Executive Summary
This article presents a production-ready MLOps architecture for real-time forecasting, applied to Belgian system imbalance forecasting. While Part 1 of this series focused on model performance, this article details the infrastructure required to reliably operate predictive models in a dynamic, 24/7 energy system.
We explain how ML6 built a cloud-native MLOps pipeline that ensures:
● Reproducible development: Strict model versioning and centralized registries.
● Continuous delivery: Automated deployment of pipelines, not just static models.
● Resilience against drift: Data validation and monitoring to handle shifting grid dynamics.
● Self-healing capabilities: Automated retraining triggers to maintain continuous performance.
● High-availability inference: Scalable, low-latency serving for grid operators and energy portfolio managers.
By combining data engineering, MLOps, and monitoring best practices, we transform experimental machine learning models into production-grade predictive systems for grid operations and energy forecasting.
From prototype to product: The engineering bridge
In part one of this 2-part series, we explored the high-stakes world of system imbalance forecasting. We demonstrated how AI can outperform traditional benchmarks to help grid operators and BRPs navigate the volatility of the energy transition.
But a model that performs well in a Jupyter notebook is just a prototype. A model that performs well at 3:00 AM on a Sunday, automatically adapting to shifting grid dynamics while serving live predictions via an API, is a product.
Bridging that gap requires more than just good data science; it requires robust Machine Learning Operations (MLOps), including data validation, continuous deployment pipelines with model versioning, and scalable inference with performance monitoring.
In this second post, we lift the hood on the infrastructure we built at ML6 to run our system imbalance forecaster. We’ll share our blueprint for a cloud-native MLOps architecture that turns experimental code into a 24/7 intelligent service - scalable, reproducible, and self-correcting.
The Challenge: It works until it doesn't
Time series forecasting for the energy grid presents a unique set of operational challenges that standard software deployment doesn't solve. The grid is a living organism: seasonal patterns change, new solar parks come online, and regulatory rules shift.
If you treat a model as a one-off software release, you inevitably hit a wall.
The trap of "linear development"
In a traditional ML workflow (see the figure below), development is often linear and manual. Data scientists manually extract test data, run experiments in notebooks, and hand off a "final" model to engineers for a one-off deployment.
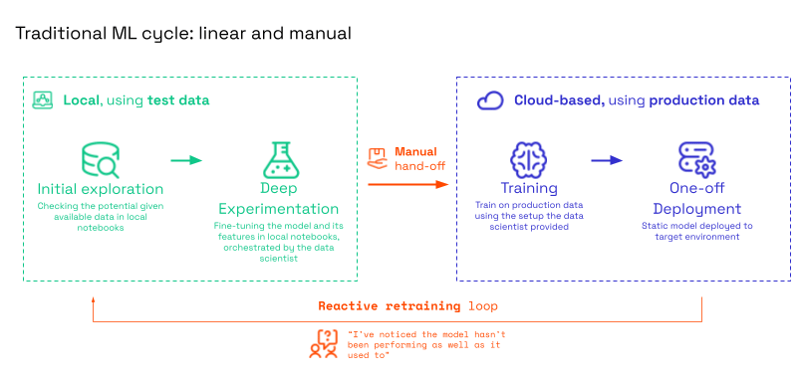
Fig: In the traditional approach, deployment is often a dead end. When the model degrades, the entire manual process must start over.
This approach works initially, but eventually fails because:
- Data drift: The training data no longer reflects reality.
- Lack of reproducibility: When a forecast errors, you can't trace which data or code version caused it.
- Maintenance hell: Retraining relies on a reactive retraining loop - you only know the model needs an update when a stakeholder complains that it hasn't been performing as well as it used to. This manual burden leads to stale models.
The MLOps Payoff
To solve this, we moved to a Streamlined MLOps workflow. Here, the focus shifts from deploying a static model to promoting code to the cloud environment. Instead of a manual hand-off, we deploy an automated pipeline that produces models.
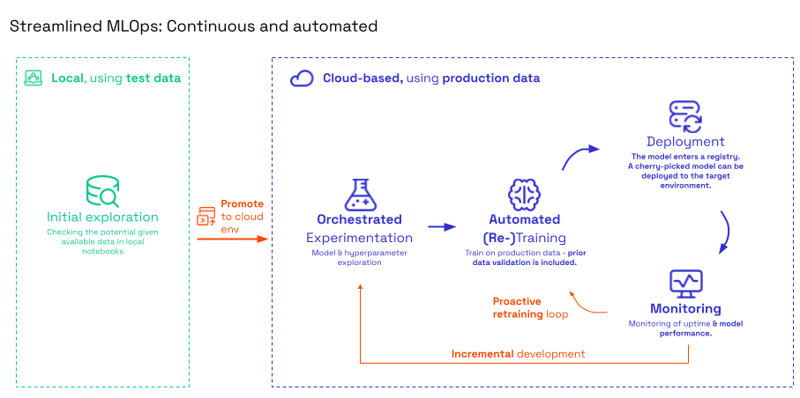
Fig: Streamlined MLOps
By automating the cycle, we create a continuous loop where monitoring triggers retraining, and new models are automatically validated and sent to a registry where the best-performing, cherry-picked model is deployed. Meanwhile, an incremental development loop ensures data scientists can continuously refine hyperparameters without breaking production.
This shift requires an upfront investment. As shown in the graph below, implementing MLOps best practices causes a short initial slowdown. However, once the "backbone" is built, the effort required for future experiments drops drastically. Critically, this modular architecture acts as a force multiplier; it allows us to rapidly integrate new model types - such as imbalance price forecasting - without the need to rebuild from scratch.
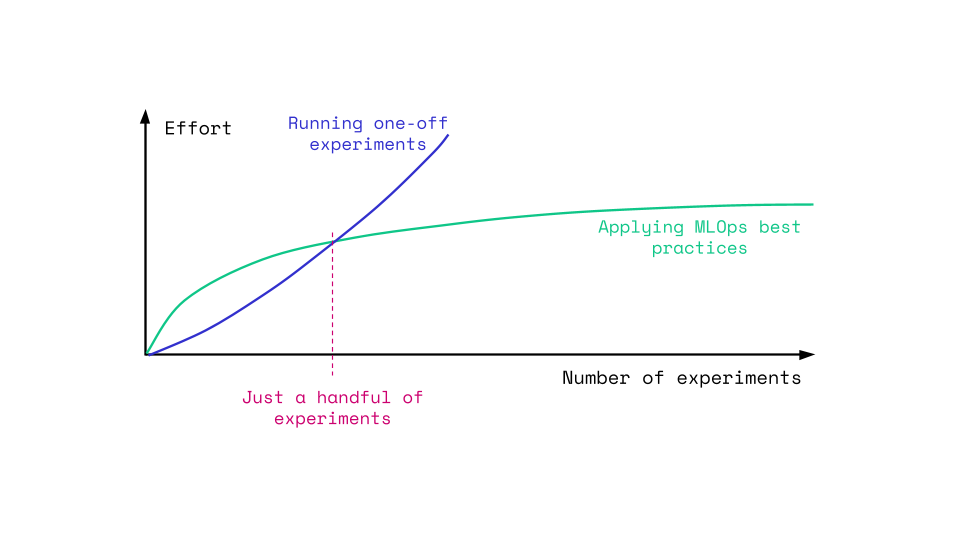
Fig: MLOps pays off after just a handful of experiments. It allows us to scale efficiently while the manual approach hits a ceiling.
The solution: A modular MLOps architecture
Our solution is built entirely on modern cloud infrastructure, leveraging managed services to reduce maintenance overhead. We designed the system around three distinct pillars: Data, Training, and Inference, all bound together by Automated Monitoring.
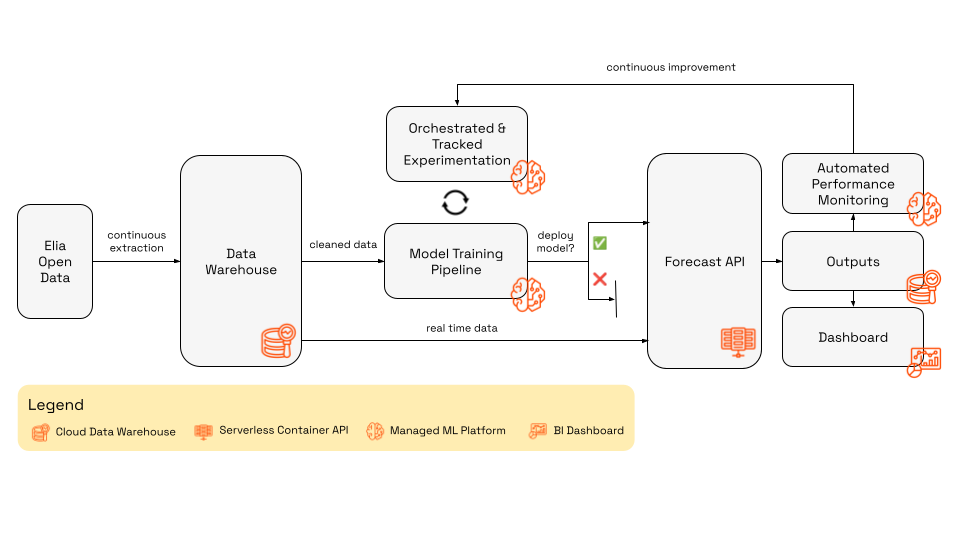
Fig: Diagram of the complete MLOps architecture for system imbalance forecasting.
1. The data layer: A "time machine" for the grid
Powered by: Serverless Compute, Cloud Data Warehouses, dbt
Garbage in, garbage out. The foundation of our setup is a robust data pipeline that ingests, cleans, and structures data from Elia’s Open Data APIs.
We treat data availability as a first-class citizen. Since operational signals (like wind forecasts or cross-border nominations) arrive with variable delays, our system must strictly account for what information is actually available at inference time to prevent data leakage.
- Ingestion: Event-driven, serverless functions trigger continuously to extract raw data and land it in a centralized cloud data warehouse.
- Transformation: We use dbt (data build tool) to manage our data warehouse using a Medallion Architecture:
- Bronze: Raw ingestion with basic row-level cleaning.
- Silver: Aggregated and standardized data.
- Gold (SI Mart): Model-ready features.
Crucially, we use dbt test to enforce data quality contracts automatically. If the grid frequency data suddenly changes format, the pipeline alerts us before it breaks the model.
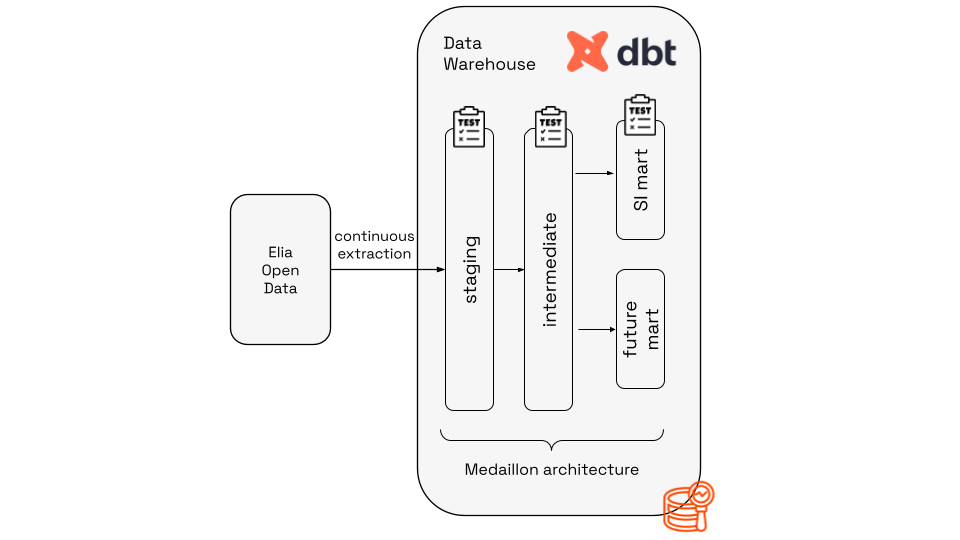
Fig: Detailed view of the data layer of the MLOps architecture.
2. The training factory: Automated & reproducible
Powered by: Managed ML Pipelines, Centralized Model Registries
We moved away from manual notebook execution to an automated training pipeline orchestrated by a managed ML orchestrator. This allows us to rapidly experiment and safely deploy.
The pipeline performs the following steps automatically:
- Fetch & Engineer: Reads the latest Gold-layer data from the data warehouse, engineer features and split the data into training, validation and test sets.
- Train: Retrains the model on the most recent history.
- Backtest: This is critical. The pipeline runs a "time travel" evaluation, testing the new model against historical data exactly as it would have appeared in the past (respecting publication delays).
- Register: If - and only if - the new model outperforms the current champion and meets our RMSE targets, it is versioned in the centralized Model Registry.
This setup ensures traceability. We can trace every prediction back to the specific training run, hyperparameters, and dataset version that generated it - a key requirement for compliance with emerging regulations like the EU AI Act.
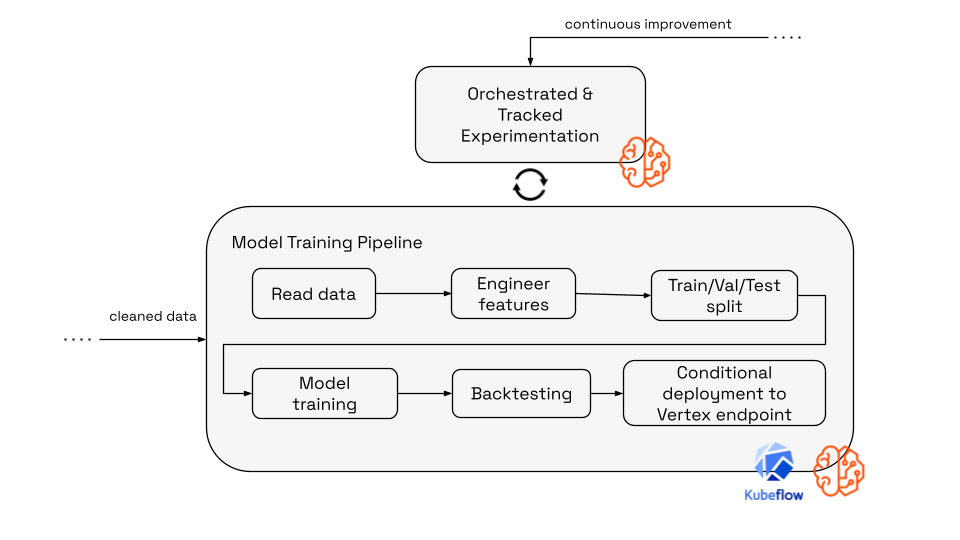
Fig: Detailed view of the training layer of the MLOps architecture.
3. The inference engine: Serving 50Hz reliability
Powered by: Serverless Containers, Managed Model Endpoints
For serving predictions, we need high availability and low latency.
- The brain: A managed model endpoint handles the model artifacts and provides a scalable environment for the model inference.
- The gateway: We host a lightweight API on serverless containers. This API acts as the orchestrator for live requests. When a request hits the API, it fetches the real-time input data from the data warehouse, performs on-the-fly feature engineering to match the training logic, and calls the inference endpoint where our champion model is deployed.
This decoupling allows us to scale the API independently of the model server. It also means we can update the model in the background without downtime for the API consumers.
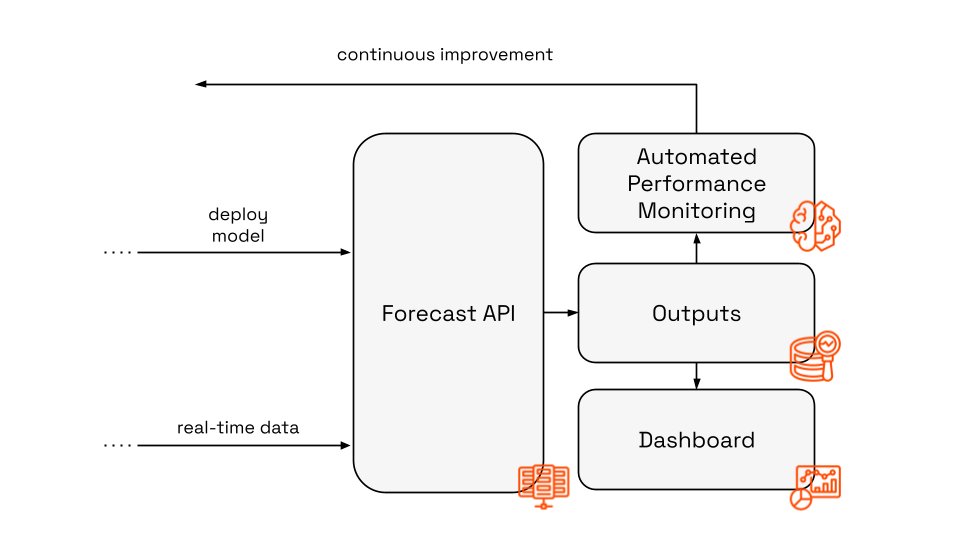
Fig: Detailed view of the inference layer of the MLOps architecture.
Closing the loop: Continuous improvement
The true power of MLOps lies in the feedback loop. We don't just fire and forget; we monitor.
We push all model predictions and actual outcomes back into our data warehouse. A real-time business intelligence dashboard provides a live view of model performance compared to the TSO benchmark.
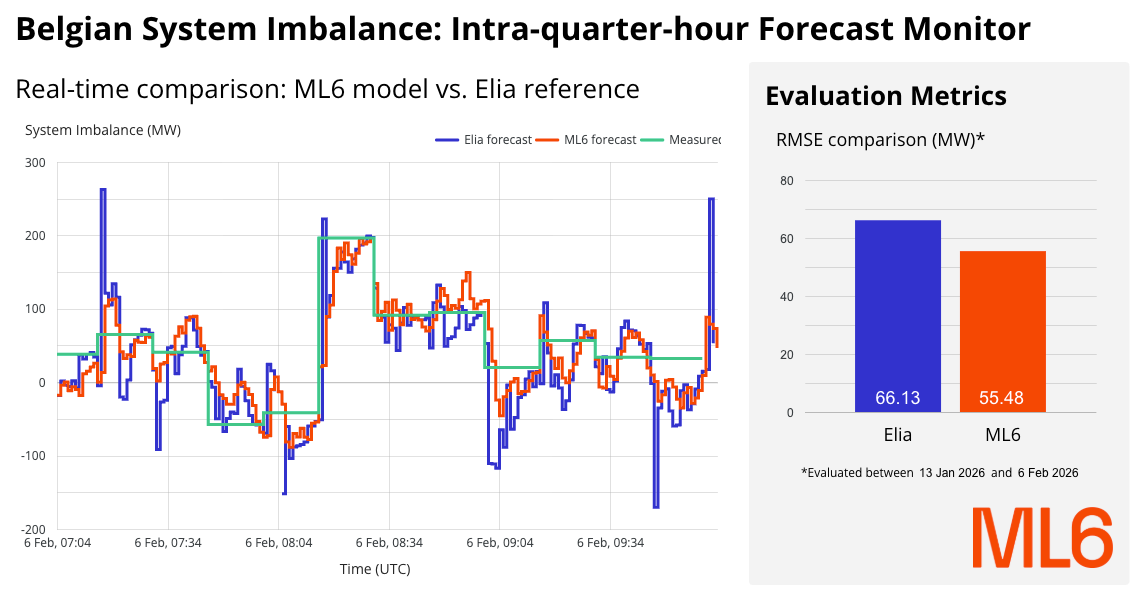
Fig: 🔴 Live dashboard comparing the performance of Elia’s and ML6’s intra-quarter-hour forecasts.
By default the model is retrained periodically, but we go a step further with automated retraining triggers. By monitoring for performance degradation. If the error rate creeps up due to a shift in grid dynamics (concept drift), the system can automatically trigger the training pipeline. This creates a self-healing system that adapts to the changing reality of the Belgian grid without manual intervention.
Conclusion: Perfection is balance
In the high-stakes environment of the energy grid, aiming for a single, "perfect" model is a trap. A model that is mathematically perfect today will be obsolete tomorrow as grid dynamics shift.
By applying DevOps principles to Machine Learning, we’ve built a system that offers the best of both worlds: the agility to experiment with new features in notebooks, and the rigidity to serve accurate, compliant forecasts 24/7.
The result is a forecast that doesn't just beat the benchmark once - it beats it consistently, minute by minute, day after day.
Interested in building similar capabilities for your energy portfolio? Let’s talk!

tomorrow’s
volatility
with AI.