

Support schemes used to absorb most of the price risk. Increasingly, they don't. The modeling stack most IPPs run predates the risk they now carry. IPPs need models that connect changes in engineering, schedules, and market prices to the financial case.
Executive Summary
Subsidy schemes no longer absorb Europe’s power-price risk. Negative-price hours doubled year on year in Q1 2026, and solar capture rates are collapsing: project revenue is now a volatile forecast, not a model input. The standard toolchain is vertical. Teams often use spreadsheets to translate engineering changes into financial assumptions, which makes it easy to miss their effect on returns. The answer is a lifecycle intelligence platform: AI-powered financial modeling that runs continuously alongside the project, re-estimating equity internal rate of return (IRR), debt service coverage ratio (DSCR), and net present value (NPV) at every phase, from site screening to construction. No two IPPs share the same risk appetite, data, or financing logic, which is why this works as a bespoke platform, not a generic software-as-a-service (SaaS) subscription.
The new risk stack in European renewables
For two decades, European renewable projects leaned on support mechanisms that reduced, though rarely eliminated, market-price risk. Those mechanisms have not disappeared: contracts for difference, premiums, and tenders all still run. What has changed is that subsidy support is more competitive and more market-responsive, and a growing share of project value now sits in capture prices, imbalance, curtailment, merchant tails, and power purchase agreement (PPA) basis risk. The mix depends on the country and auction structure, but the broader trend is clear: revenue is no longer a reliable model input. It’s an increasingly uncertain forecast.
Solar’s earning power is eroding faster than most financial models are recalibrated. Across EU bidding zones in ENTSO-E day-ahead data, aggregate negative-price zone-hours reached 1,223 in Q1 2026, more than double the 593 of Q1 2025 and over ten times the 119 of Q1 2022. Germany's solar capture rate, the ratio of what solar actually earns to the baseload average, fell from roughly 0.84 in 2023 to 0.505 in 2025 on official annual market values. Pexapark’s analysis measured French solar capture rates at 0.10 in April 2026, down from 0.42 a year earlier.
Limited grid connection capacity creates another constraint on development; available connection capacity has become the scarcest resource in European development. Roughly 1,700 GW of renewable and hybrid capacity sits in European grid connection queues. Aurora Energy Research put European congestion management costs near €9 billion in 2024, with 72 TWh of mostly renewable generation curtailed. Financing costs run to 25–30% of utility-scale solar levelised cost of electricity (LCOE) in advanced economies, making returns unusually sensitive to the cost of capital.
The industry has plenty of tools for this. Yield goes to PVsyst or Windographer; price curves to Pexapark, Aurora, or Enervis; dispatch to a battery energy storage system (BESS) optimizer; grid studies to PowerFactory. Each is strong inside its own layer. The problem is that they are vertical: none propagates a decision made in one layer into its consequence in another, so the joints are held together in a workbook. Change the inverter loading ratio, and nothing recomputes the coverage ratios. Push the commercial operation date by four months and the capture price against the new market window isn’t adapting.
That seam is where margin quietly disappears: in eroded returns, delayed timelines, and equity injected late and expensively. Our view is straightforward. In a market this exposed, financial modeling can't remain a static reporting exercise performed at milestones. It has to become a continuous engineering discipline, running alongside the project itself.
The danger of the “happy path”
Most development cycles are built on an optimistic base case. Take an illustrative 100 MW solar project, modeled with a standard grid connection cost, a linear twelve-month permitting process, and annual average energy prices: on paper, a robust 9% equity IRR. Reality does not happen on a spreadsheet, and three things tend to go wrong, each now measurable with public data.
-
The grid shock
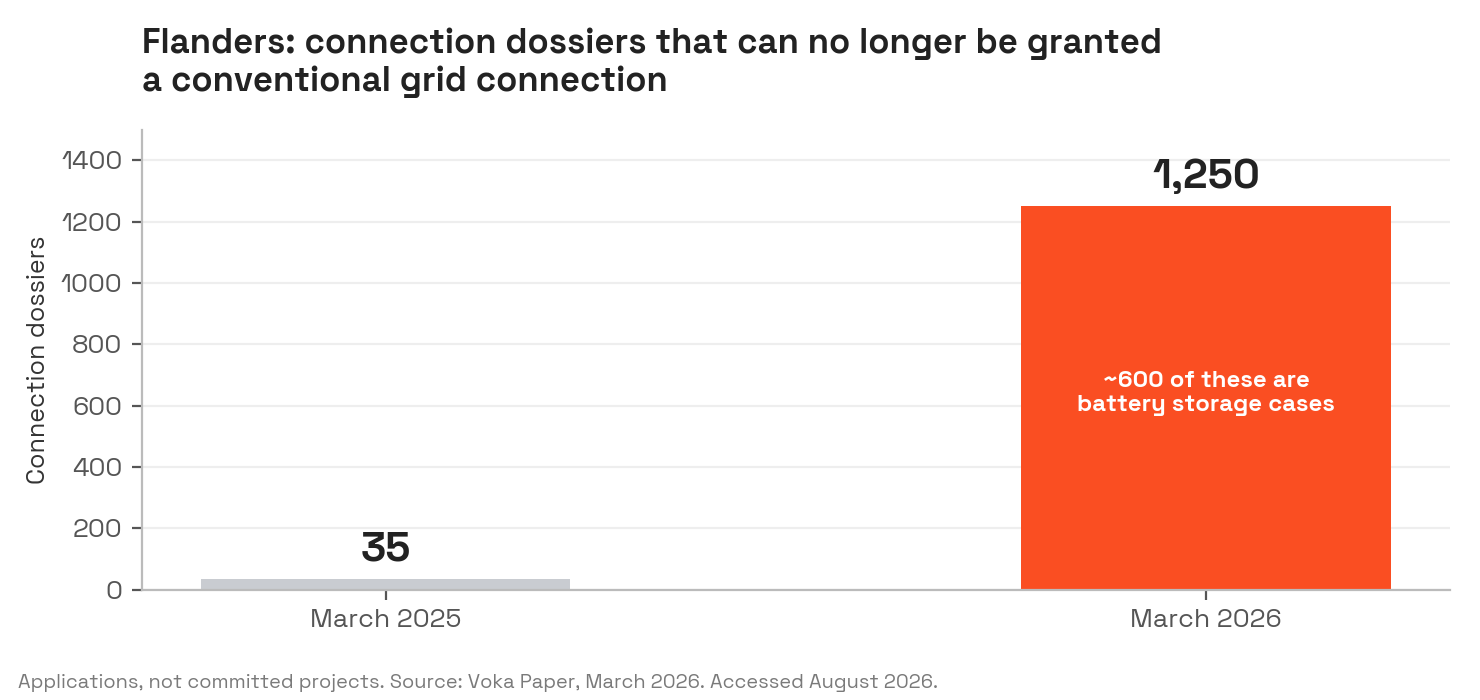
The local substation turns out to be saturated, triggering an unbudgeted reinforcement cost. This is no longer an edge case. In Flanders, the number of connection dossiers that can no longer be granted a conventional connection rose from 35 in March 2025 to roughly 1,250 twelve months later, according to Voka's March 2026 paper; around 600 were battery cases. These are applications, not committed projects, but the trend is what matters. The Netherlands shows where it leads: at the end of 2025, regional network operators reported 15,014 off-take and 8,687 feed-in requests waiting.
2. The permitting delay
A municipal appeal stalls the permit, inflating holding costs and pushing the commercial operation date into a less favorable market window. EU Directive RED III limits permit-granting to twelve months inside renewable acceleration areas and two years outside them, subject to specified extensions. SolarPower Europe's 2025 tracking found several member states still above two years, with some processes reaching four, twice the outside-area limit, four times the acceleration-area one. A 2025 Commission proposal notes that permitting can still take up to nine years, depending on country and technology.
3. The cannibalization effect
Because the model relied on annual averages, it never saw the intraday reality: the asset produces peak power exactly when every other solar plant in the country is flooding the grid. Solar capture rates across Europe's core markets fell sharply between April 2025 and April 2026. Over the same period, the share of solar output produced during negative-price periods increased.
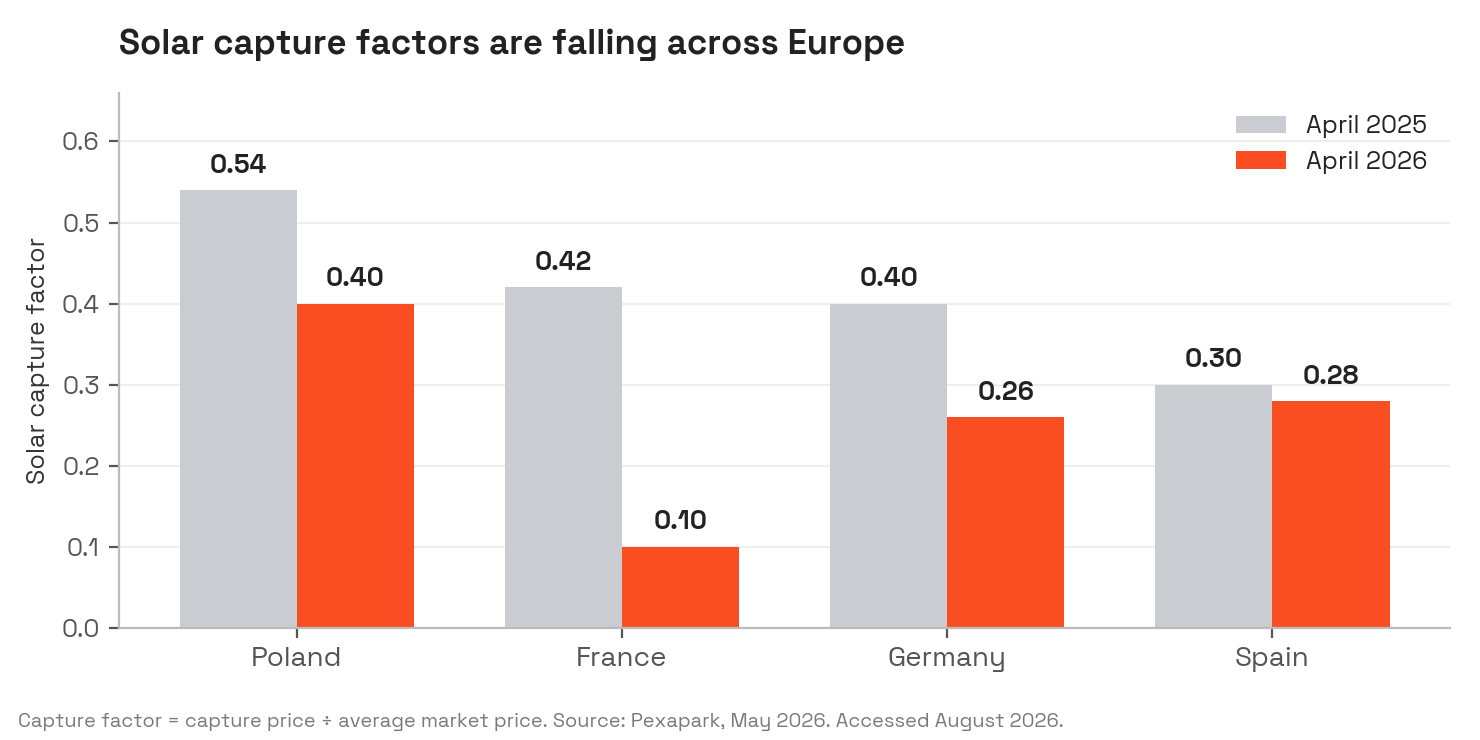
The pressure is primarily structural (more solar chasing the same midday demand), though weather, shoulder-season demand, and export constraints amplify individual months. In Germany, the share of solar output falling in negative-price hours rose from 14.5% in 2024 to 23.4% in 2025, against a record 573 negative day-ahead hours.
By the time a project reaches the bank's credit committee, lenders can see these risks are unmitigated. They price accordingly: a haircut on projected revenue, or lower debt sizing, larger reserves, tighter covenants, and a higher margin. Whichever lever moves, the sponsor absorbs it, often as additional equity that dilutes returns and traps capital meant for the next asset.
What does a lifecycle intelligence platform actually do?
The way out is a lifecycle intelligence platform: a single environment that unifies geospatial, engineering, market, and financial data, and keeps them connected from first land option through to construction. Once the data is connected, AI can help estimate delay risks and draft documents using the latest project assumptions, via:
- probabilistic simulation where schedules used to be a guess
- generative AI that turns weeks of analysis and drafting into days
The platform updates the financial case whenever project assumptions change. Rather than producing a financial model at milestones, the platform re-estimates the metrics that decide the project- equity IRR, coverage ratios, NPV- at every phase, each time replacing an assumption with a measurement. Early DSCR is pro forma, since no real debt structure sits behind it yet, and it becomes decision-grade as the financing case matures. That is the funnel: the same questions, progressively fewer guesses behind them. It does not only narrow - a discovered grid constraint can widen the range again, and a model that cannot show that is not telling you the truth.
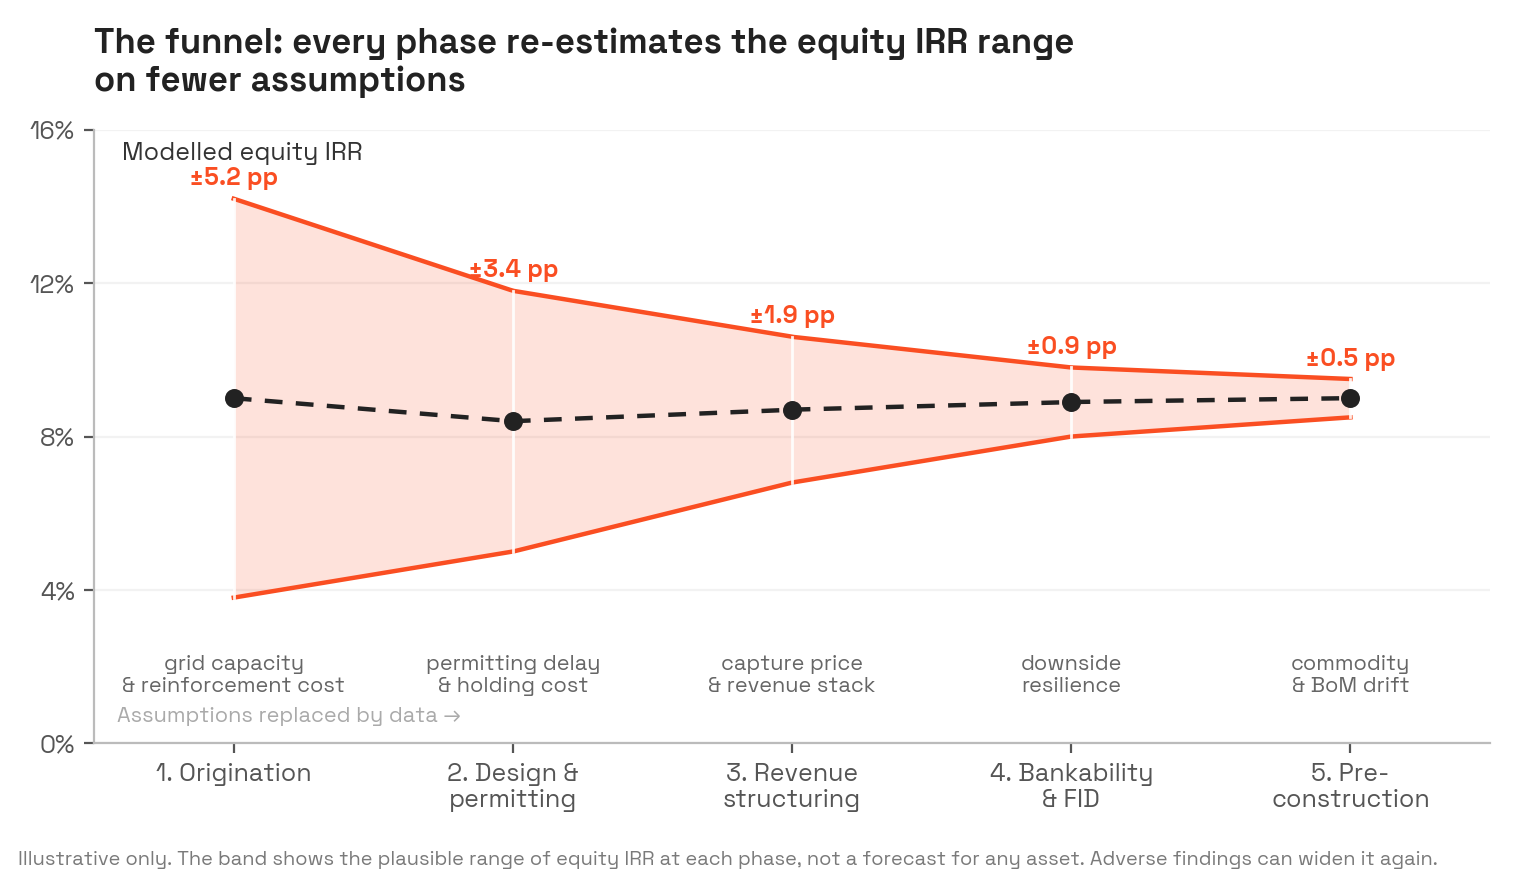
It also means judging projects against a portfolio rather than in isolation. A prospect whose cash flows correlate poorly with the existing fleet may improve risk-adjusted portfolio value even when its standalone IRR is not the highest in the pipeline. However, the test is cash-flow covariance after capture prices, curtailment, and covenants, not generation profiles alone.
In our experience at ML6, the platform needs to accommodate each IPP's financial assumptions, lender requirements, and proprietary data. This doesn't come as a generic SaaS subscription. IPPs differ in risk appetite, pipeline strategy, or proprietary data, and the architecture has to support configurable financial logic, auditable assumptions, lender-specific covenants, and market-specific modules, which is rarely available off the shelf.
That blueprint has five phases, and AI does different work in each.
Phase 1 — Smart origination
Assess grid feasibility alongside land availability and expected yield. Traditional origination focuses on land and resources, leaving grid feasibility as an afterthought. Reverse it: use AI to extract and structure connection capacity and constraint information from the dispersed, often unstructured data published by grid operators, then overlay it with high-yield locations to screen connection complexity and route cost early. This is where geospatial machine learning adds the most value.
Models trained on land use, grid topology, and historical connection outcomes rank thousands of parcels in the time a team used to assess a handful. Real reinforcement cost depends on topology, thermal and voltage limits, fault levels, and queue position, so it still needs network studies. But the screen keeps capital off sites that were never going to work, and produces a first IRR range while walking away is still cheap.
Phase 2 — Design and permitting
Time is the most expensive variable in development, and the one modeled least rigorously. Replace optimistic static schedules with probabilistic risk modeling: if public historical data suggests a material chance of appeal in a given region, simulate that delay as a financial event, not a date shift. A slipped commercial operation date extends development expenditure (DEVEX) and inflates future capex. However, the larger hit is that it moves the asset into a different market window, with different capture prices and a different negative-hour profile. This is the propagation that usually lacks: every schedule scenario re-prices the revenue case, so leadership sizes contingency to a probability range rather than a feeling, before the first permit is filed.
The same historical corpus does double duty: generative AI drafts and pre-checks permit dossiers against local precedent and regional requirements.
Phase 3 — Revenue structuring
You cannot finance a modern asset on annual averages. Build the financial twin on quarter-hourly data and simulate a full twenty-year life across multiple weather years and price scenarios, including curtailment, imbalance, degradation, and cycling limits. Probabilistic simulations replace the static price curve here, not because they predict the future, but because they quantify how wrong the base case can be.
The engine should also optimize across the whole revenue stack, not one stream at a time. A co-located battery earns from wholesale arbitrage, frequency and balancing services, and capacity payments, but the relative value of those streams shifts as markets saturate. Capstone's analysis points to German frequency containment prequalification outrunning demand, with average German day-ahead spreads narrowing from around €120/MWh in 2022 to €80–90/MWh in 2025. A model that assumes today's revenue mix holds for twenty years is wrong on day one. Simulating the stack over the full horizon tests candidate BESS sizes and hedge ratios against the covenants and the downside cases, instead of leaving both to judgment.
Phase 4 — Bankability and final investment decision (FID)
Before investment committee review, the team should be able to trace the financial assumptions and show how the project performs under downside scenarios. The platform should identify where covenant headroom holds and where it fails. Every lever a lender pulls- the revenue haircut, the lower debt sizing, the larger reserve, the wider margin- is the price of a question the sponsor could not answer with evidence. The platform's job in this phase is to answer them before they are asked: run the downside cases lenders will run anyway, the P90 energy yield (the output level the asset should exceed in 90% of years), a merchant price crash, and a supply-chain shock. The platform will show covenant headroom holding under each one, every assumption traceable to a measurement made in the phases before.
Generative AI then compresses the last mile. It assembles the investment memo directly from the live model, so the narrative and the numbers cannot drift apart, and it works as a red team before the real one: interrogating your own case. Leverage, pricing, and FID timing still depend on contracts, risk allocation, and lender appetite. Modeling does not remove that negotiation; it decides who walks in prepared.
Phase 5 — Pre-construction
The window between FID and breaking ground is where locked-in margin quietly erodes, as copper, steel, and module prices move. Track live material costs against the FID baseline continuously. But an alarm is not enough: the platform should act as a value engineer, simulating technically compliant alternatives, a resized and revalidated aluminum-conductor design in place of copper, for instance, and quantifying how much of the margin lost since FID each one recovers, before contracts are signed.
The strategic imperative
Software does not put steel in the ground. But in a merchant-exposed market, deployment speed is bottlenecked by how fast risk can be modeled and mitigated, and Europe cannot build at the required pace if viable projects die in the spreadsheet phase, killed by grid constraints nobody priced, price crashes nobody hedged, and permitting delays nobody provisioned for.
Closing the gap between engineering reality and financial modeling changes how IPPs allocate capital. When every engineering, schedule, and market decision propagates into the financial case, teams can identify risks earlier, revise designs sooner, and focus investment on the projects that remain bankable under uncertainty. The result is not a perfect forecast, but a portfolio built to withstand volatility rather than react to it.
Sources
- Sen, S. (2026, May 8). Europe's negative electricity price hours double in Q1 amid renewables surpluses, market imbalances. pv magazine. https://www.pv-magazine.com/2026/05/08/europes-negative-electricity-price-hours-double-in-q1-amid-renewables-surpluses-market-imbalances/
- Horn, A. (2026, January 15). Der Jahresmarktwert Solar 2025 [The annual market value of solar 2025]. Deutsche Gesellschaft für Sonnenenergie e.V. (DGS). https://www.dgs.de/newsletter/der-jahresmarktwert-solar-2025/
- Bayerische Landesanstalt für Landwirtschaft (LfL). (2026, January 26). Jahresmarktwert stabilisiert sich – Negative Preise nehmen zu: Solar/Photovoltaik – Strommarkt in den Jahren 2025 und Vorjahre [Annual market value stabilizes – negative prices increase: Solar/photovoltaic – electricity market in 2025 and previous years]. https://www.lfl.bayern.de/iba/energie/372343/index.php
- Pexapark. (2026, May). European solar capture factors collapse as April oversupply triggers wave of negative prices. https://pexapark.com/blog/european-solar-capture-factors-collapse-as-april-oversupply-triggers-wave-of-negative-prices/
- Beyond Fossil Fuels, Ember, E3G, & Institute for Energy Economics and Financial Analysis (IEEFA). (2025, May). How Europe's grid operators are preparing for the energy transition: A snapshot of electricity transmission system operator practices and plans. Beyond Fossil Fuels. https://beyondfossilfuels.org/wp-content/uploads/2025/05/REPORT_FINAL.pdf
- Aurora Energy Research. (2026, January). The state of European power grids: A meta-analysis [Press release: "Europe's three-fold solar and wind growth sparks urgent grid investment, Aurora finds"]. https://auroraer.com/company/press-room/europes-three-fold-solar-and-wind-growth-sparks-urgent-grid-investment-aurora-finds
- Voka vzw. (2026, March 4). Doortastende aanpak netcongestie moet dreigende miljardenschade vermijden [Decisive approach to grid congestion must avoid looming billion-euro damage]. https://pers.voka.be/doortastende-aanpak-netcongestie-moet-dreigende-miljardenschade-vermijden
- Netbeheer Nederland. (2026, March). Bouw versnelt opnieuw, maar de vraag loopt nog steeds op [Construction accelerates again, but demand keeps rising] (Stand van de Uitvoering 2025). https://www.netbeheernederland.nl/artikelen/persbericht/bouw-versnelt-opnieuw-maar-de-vraag-loopt-nog-steeds-op
- European Union. (2023). Directive (EU) 2023/2413 of the European Parliament and of the Council of 18 October 2023. EUR-Lex. https://eur-lex.europa.eu/eli/dir/2023/2413/oj/eng
- SolarPower Europe. (2025, July 16). EU renewable energy permitting: State of play. https://www.solarpowereurope.org/insights/thematic-reports/eu-renewable-energy-permitting-state-of-play
- European Commission. (2025, December 10). Proposal for a directive of the European Parliament and of the Council amending Directives (EU) 2018/2001, (EU) 2019/944, (EU) 2024/1788 as regards acceleration of permit-granting procedures (COM(2025) 1007 final). EUR-Lex. https://eur-lex.europa.eu/legal-content/EN/TXT/HTML/?uri=CELEX%3A52025PC1007
- Calatayud, B. (2025, November 24). Europe's battery storage edge. Capstone DC. https://capstonedc.com/insights/europes-battery-storage-edge/
- International Energy Agency (IEA). (2025, September 26). Cost of Capital Observatory. IEA, Paris. https://www.iea.org/reports/cost-of-capital-observatory